Info Panel
The information panel on the left has several different modes that it uses to display information, depending on what is selected on the main map.
Local Station
If nothing is selected on the map, the info panel will display information about your local station.
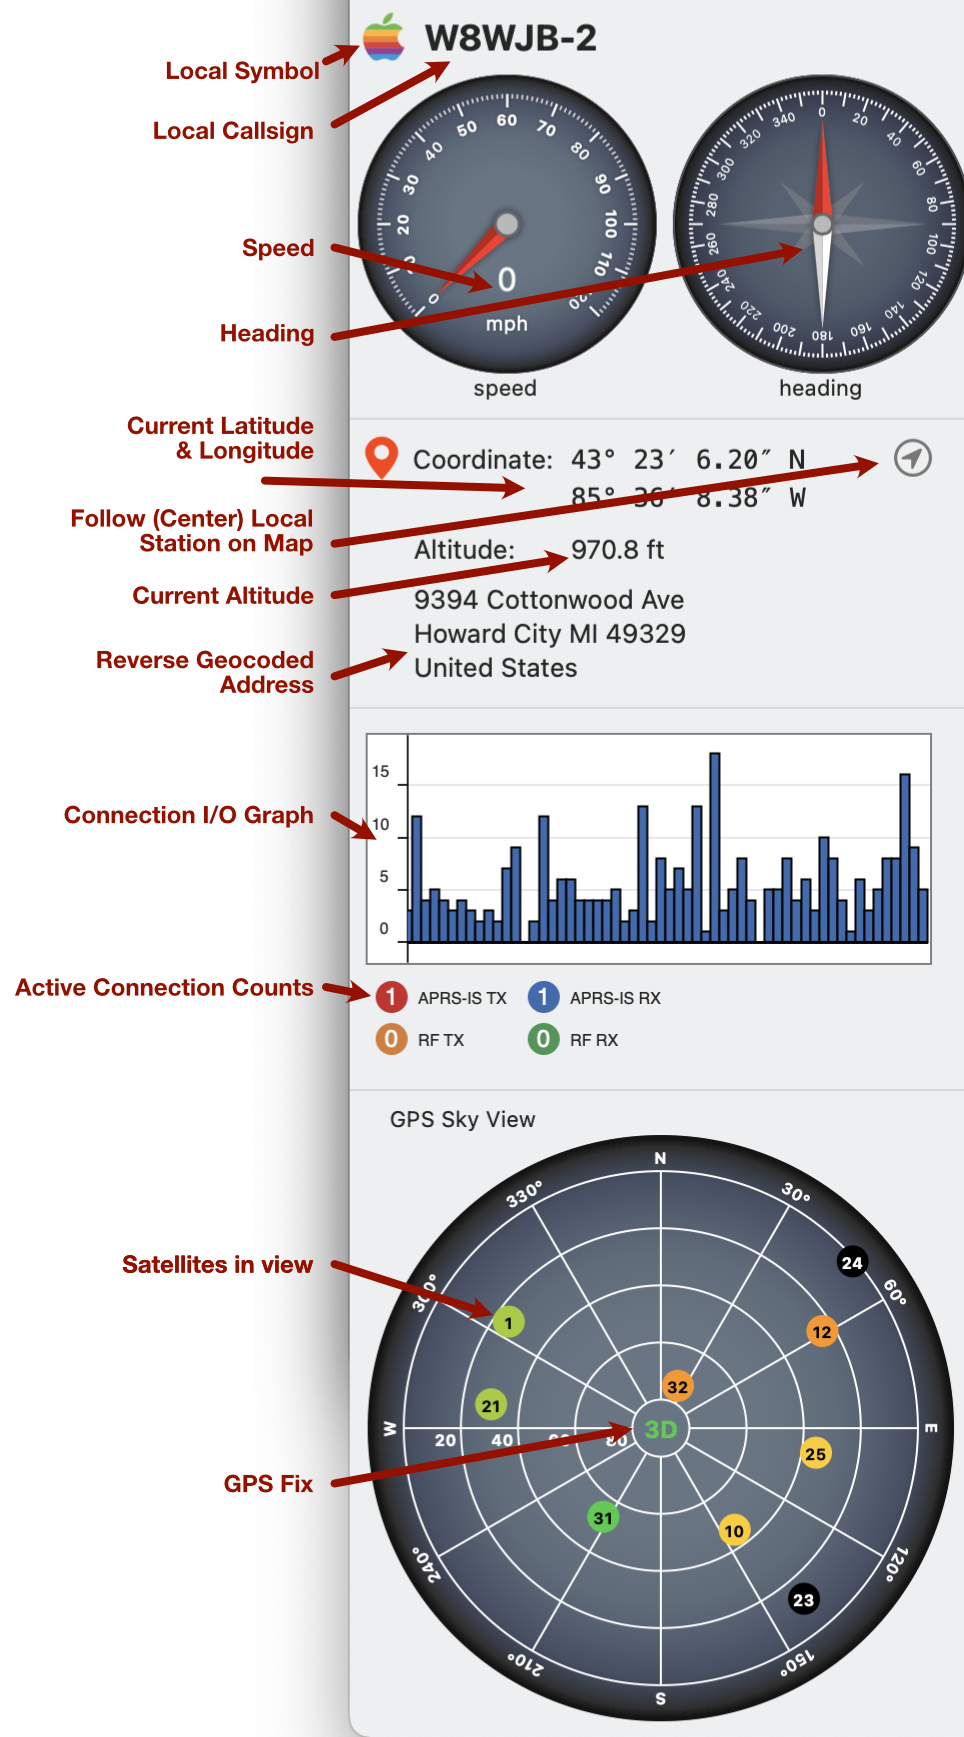
Note: In the absence of an external GPS unit, QTH will use Mac OS Core Location Services. Unlike iOS, a MacBook does not contain a GPS, so it will use IP Geolocation to estimate your location. With this estimated location, it is unlikely that the speed and heading will be non-zero.
- Local Symbol - Local symbol chosen in
Preferences... - Local Callsign - Local callsign chosen in
Preferences... - Speed - Current speed
- Heading - Current heading
- Coordinate - Current latitude and longitude
- Follow Local Station - When toggled on, the map will be centered on the local station and will pan as the location changes. Panning the map somewhere else will cancel the follow mode.
- Altitude - Current altitude
- Reverse Geocoded Address - QTH will submit the coordinate to Apple’s Geolocation service to find the nearest address. This information is not transmitted by the APRS station and is an estimate.
- Connection I/O Graph - Shows a realtime graph of the data packets that are being received and transmitted. The transmit and receive lines are separated by the type of transmission, either RF or Internet.
- Active Connection Counts - Summarized view of the Connections window showing counts of how many connections are actively receiving and how many are enabled for transmit.
GPS Sky View
If you have an active GPS Connnection that supports the NMEA protocol, a Sky View plot will appear. This is a polar plot with the satelites plotted at their azimuth and elevation in relation to the GPS reveiver.
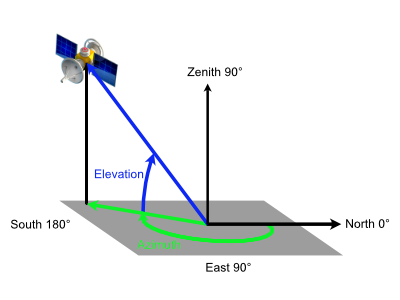
- Azimuth is a 0-360 angle, with north at the top.
- Elevation is the angular distance above the horizon, where 0° is the horizon and 90° is directly overhead. This is represented on the plot as the distance from the center. Satellites on the horizon would be plotted at the edge of the circle, while satellites overhead would be at the center.
Satellite numbers are placed in the colored circles. The color of the circle indicates the signal strength:
- < 10
- < 20
- < 30
- < 40
- > 40
- black == not in use
The middle of the sky view plot contains and indicator of the GPS fix quality:
- ∅ - Fix not available or invalid
- 2D - 3 satellites are in use
- 3D - 4 or more satellites are in use
Selected Station
When a station is selected on the map, its details will appear in the info panel.
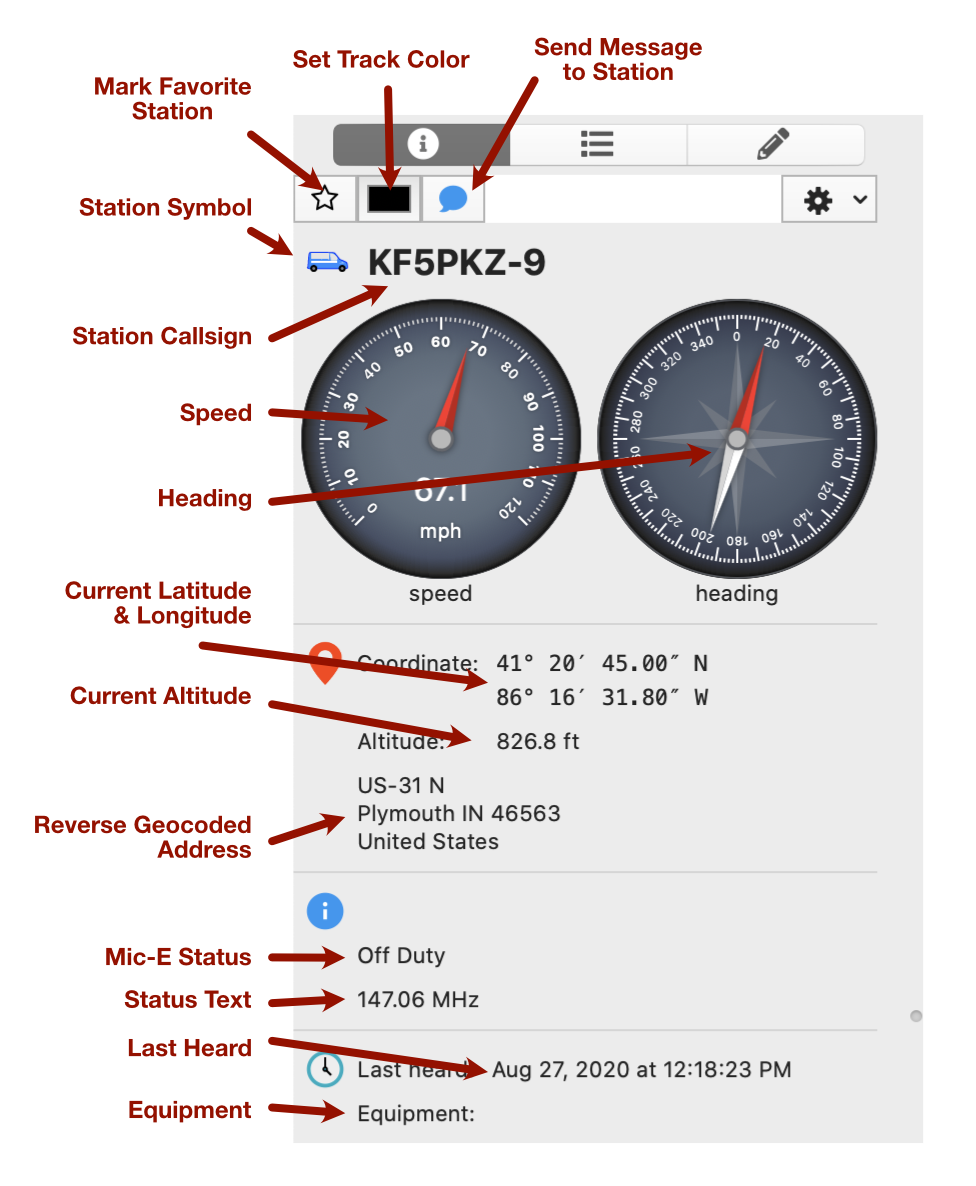
- Mark Favorite Station - Clicking this button will mark the station as a favorite station. Favorite stations can be shown/hidden in the
Viewmenu - Set Track Color - Choose a line color for the track line of a moving station
- Send Message to Station - Click this button to jump to the
Messageswindow to begin composing a message to the station - Station Symbol - Symbol sent by the station
- Station Callsign - Station callsign + SSID suffix
- Speed - Station’s speed
- Heading - Station’s heading
- Coordinate - Station’s current latitude and longitude
- Altitude - Station’s current altitude
- Reverse Geocoded Address - QTH will submit the station’s coordinate to Apple’s Geolocation service to find the nearest address. This information is not transmitted by the APRS station and is an estimate.
- Mic-E - Status message sent with a Mic Encoded packet
- Status Text - Last status text the station sent
- Last Heard - Last time a report was received from this station
- Equipment - Any information about the equipment/rig in use by the station
Weather Station
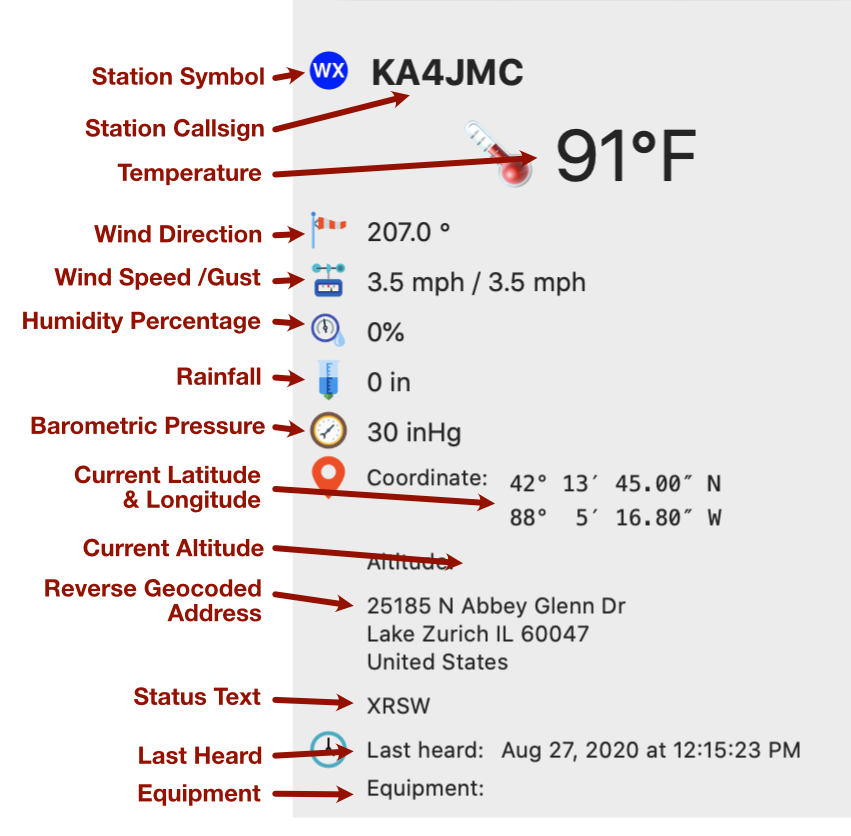
- Station Symbol - Symbol sent by the station
- Station Callsign - Station callsign + SSID suffix
- Temperature - Temperature reported by the station
- Wind Direction - Wind direction reported by the station
- Wind Speed - Wind speed reported by the station. Second number is the speed of wind gusts.
- Humidity Percentage - Humidity reported by the station
- Barometric Pressure - Barometric pressure reported by the station
- Coordinate - Station’s current latitude and longitude
- Altitude - Station’s current altitude
- Reverse Geocoded Address - QTH will submit the station’s coordinate to Apple’s Geolocation service to find the nearest address. This information is not transmitted by the APRS station and is an estimate.
- Status Text - Last status text the station sent
- Last Heard - Last time a report was received from this station
- Equipment - Any information about the weather equipment in use by the station
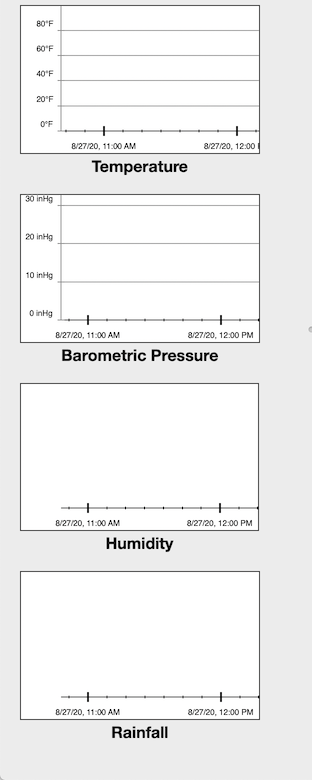
Weather History Graphs
QTH stores a history of the reports received from a weather station and presents the data as 4 graphs over time:
- Temperature
- Barometric Pressure
- Humidity
- Rainfall
These graphs can be scrolled left and right to see more history.